Event function blocks
Introduction
During lectures and self-study, you learnt about IEC 61499 and its artifacts. This task is designed to be an exercise in development of basic and composite FBs, understanding concept of event driven execution, understanding timing diagrams, testing your FBs by developing test applications. You need to develop assigned FBs and design appropriate applications to test them correctly.
Task description
The goal of the task is to re-implement the 4 Service-Interface Function Blocks from the standard library that is assigned to you in the appendix. The specification and the behavior of the FBs are given in the form of timing diagrams.
You can develop your FBs as either basic or composite FBs. If you are using composite FBs, you are encouraged to re-use FBs from the standard library if necessary (e.g. timing FBs, latches etc).
If you are unsure about certain behavior of your FBs, you can run the equivalent FB from the standard library. We expect your implemented FB to exhibit the same behavior as that of the standard library.
You are required to document your design process in the form of a report. In the report, you are asked to include the following:
- Introduction
- Requirements and Specification
- Design
- Implementation
- Testing
- Conclusion
The structure and the content of your report is explained in the Report Structure section below. Note that reporting is a big part of all the Tasks, and you will be asked to submit similar reports in all tasks and projects.
Please take note of the “Designs to avoid in IEC 61499” document under Tasks/Example/. This document specifies several design mistakes to avoid.
Deliverables
The deliverables are as follows:
- 4 IEC61499 solution files
- 1 solution file for each FB
- In each solution file, include a test application demonstrating how you tested your FBs
- Report
Report Structure
In canvas, you have been provided a “Report Template” under Tasks/Example/
You need to include the following in each sections of the report
Introduction
Describe the aim of the tasks and the intended learning outcome of this tasks. This section should be maximum 1/4 of the page.
Requirements and Specifications of the System
Include at least 1 requirement for each of your FBs. If the FB has more than 1 behavior, then you should list all the requirements. Use Natural Language description of the requirement of your FB and illustrate with timing diagrams. Note that you should not reuse the timing diagrams from the appendix. You need to redraw the timing diagrams with PlantUML (http://plantuml.com/timing-diagram).
System Design
Describe the design of your system. This can be in the format of state diagrams or sequence diagrams. REMEMBER to explain and elaborate on your design decisions. Do not just put images, you need to explain in detail of what’s shown in the images.
http://plantuml.com/sequence-diagram
http://plantuml.com/state-diagram
Implementation in IEC 61499
Implementation of your IEC 61499 control application. Figures can include your FB interfaces, ECCs and the FB network. REMEMBER to explain and elaborate on how the IEC 61499 application reflects your system requirements and design. You can also use a video to describe your implementation. Maximum 5 minutes
Testing
Describe your test scenario and include figures showing the results of your test. This can include HMI and IEC 61499 application showing watch values. Consider using video report for this part of the report.
It’s recommended to include description of your test for each requirement that you have specified. You can use bullet points to list the step expected behavior of FB system at each step of testing.
Reflection
Reflect on what you have learnt as part of this task.
Remember to not include your name neither in the code nor in the report or submission file names.
Marking guideline
You will be graded based on the marking guideline below.
- Specification
- Correctness of the specification in Natural Language with Timing Diagram
- Design: ECC and FB Network
- Correctness of the implementation of ECC and FB network.
- Behavior (Completeness and Correctness)
- Correct behavior is demonstrated.
- Testing
- Correctness of the designed test application. Does the designed test application correctly test the defined FB specification?
- Report and Documentation
- Fairness, completeness and the correctness of the report.
Appendix 1
| Student | Task (function block) | Comments | |
|---|---|---|---|
| 1 | 3, 7, 10, 11 | ||
| 2 | 4, 8, 11, 12 | ||
| 3 | 5, 9, 12, 13 | ||
| 4 | 6, 7, 10, 13 | ||
| 5 | 3, 8, 10, 12 | ||
| 6 | 4, 9, 11, 13 | ||
| 7 | 5, 8, 11, 12 | ||
| 8 | 6, 9, 10, 13 | ||
| 9 | 4, 7, 12, 13 | ||
| 10 | 3, 9, 11, 13 | ||
| 11 | 5, 7, 10, 12 | ||
| 12 | 6, 8, 10, 11 | ||
| 13 | |||
| 14 | |||
| 15 | |||
| 16 | |||
| 17 | |||
| 18 | |||
| 19 | |||
| 20 | |||
| 21 | |||
| 22 | |||
| 23 | |||
| 24 | |||
| 25 | |||
| 26 |
Appendix 2
| Implement as basic FB | ||
|---|---|---|
| 1 | Periodic (cyclic) generation of an event | An event occurs at EO at an interval DT after the occurrence of an event at START, and at intervals of DT thereafter until the occurrence of an event at STOP. 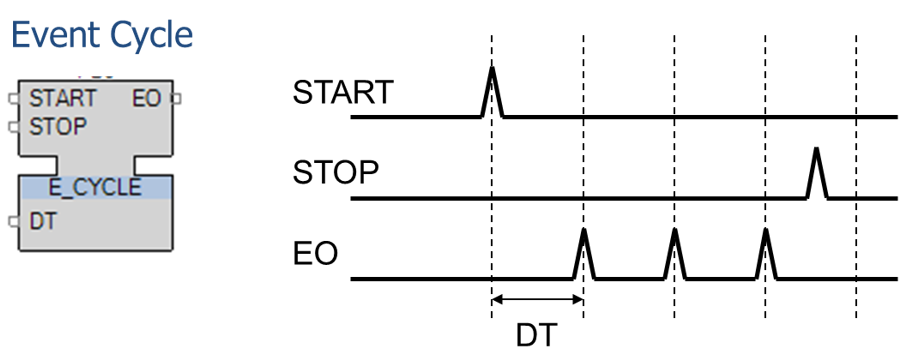 |
| 2 | Delayed propagation of an event | An event at EO is generated at a time interval DT after the occurrence of an event at the START input. The event delay is cancelled by an occurrence of an event at the STOP input. If multiple events occur at the START input before the occurrence of an event at EO, only a single event occurs at EO, at a time DT after the first event occurrence at the START input. 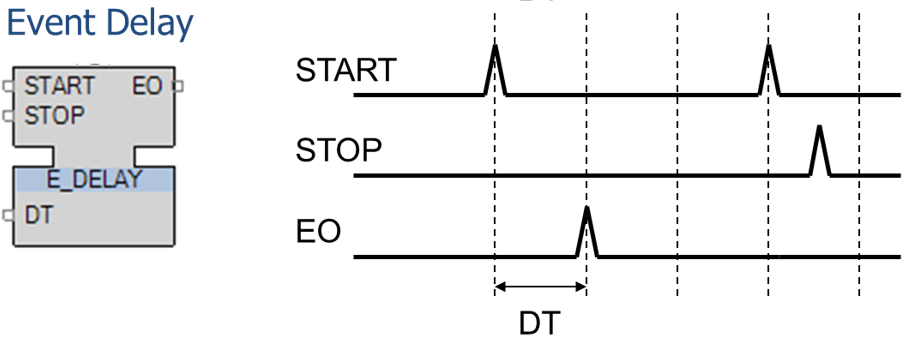 |
| 3 | Event Rendezvous | EO event is to be emitted after both EI1 and EI2 have occurred once. Input R resets the process. 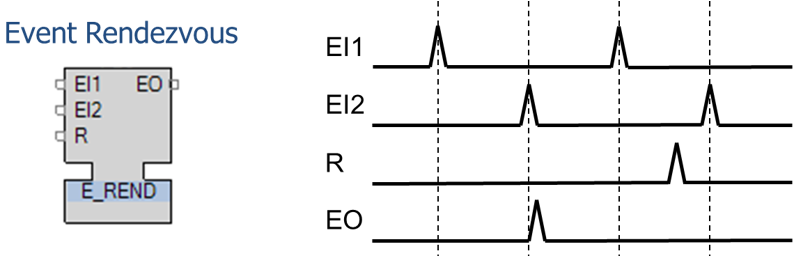 |
| 4 | Event Permit | Permissive propagation of an event 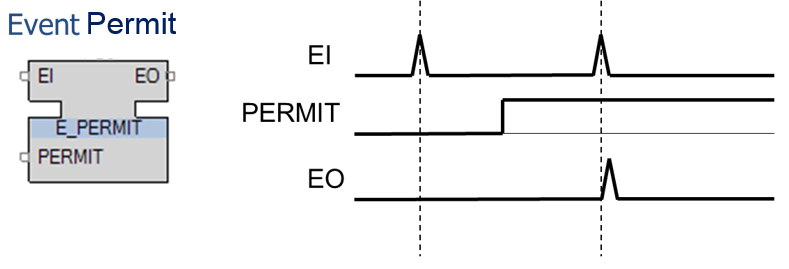 |
| 5 | Event Select | Selection between two events 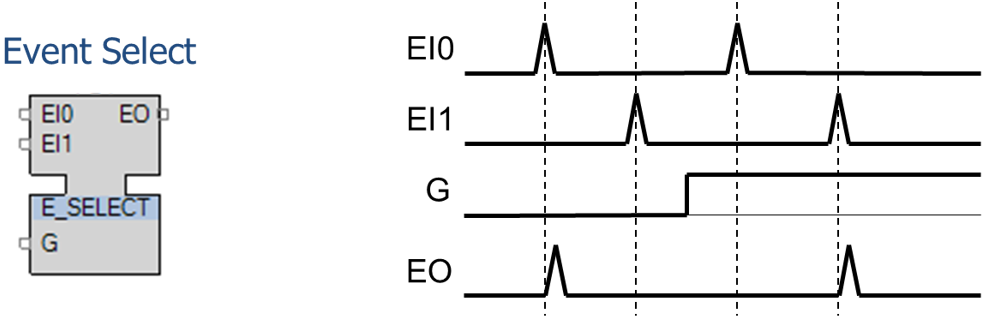 |
| 6 | Event Switch | Switching (demultiplexing) an event 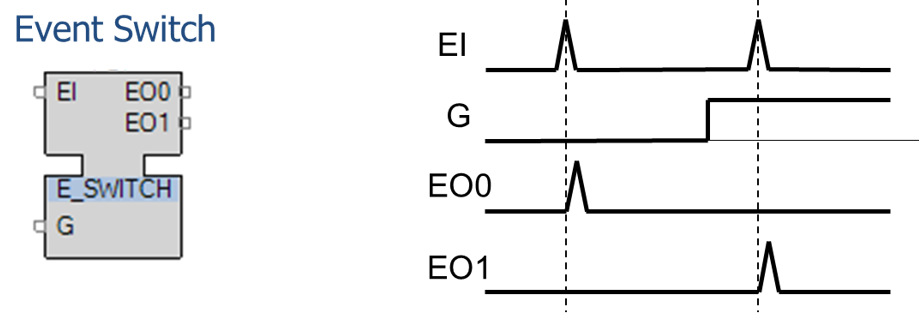 |
| 7 | Increasing counter | At each CU event the CV is incremented. Q becomes TRUE when CV is equal or greater than PV.  |
| 8 | Event Driven Bistables | The output Q is set to 1 (TRUE) upon the occurrence of an event at the S input, and is reset to 0 (FALSE) upon the occurrence of an event at the R input. An event is issued at the EO output when the value of Q changes. NOTE: The implementation of both function block types is identical. Both E_SR and E_RS are implemented for consistency with the SR and RS types of IEC 61131-3, although there is no "dominance" of events as there would be for level-controlled R and S inputs. 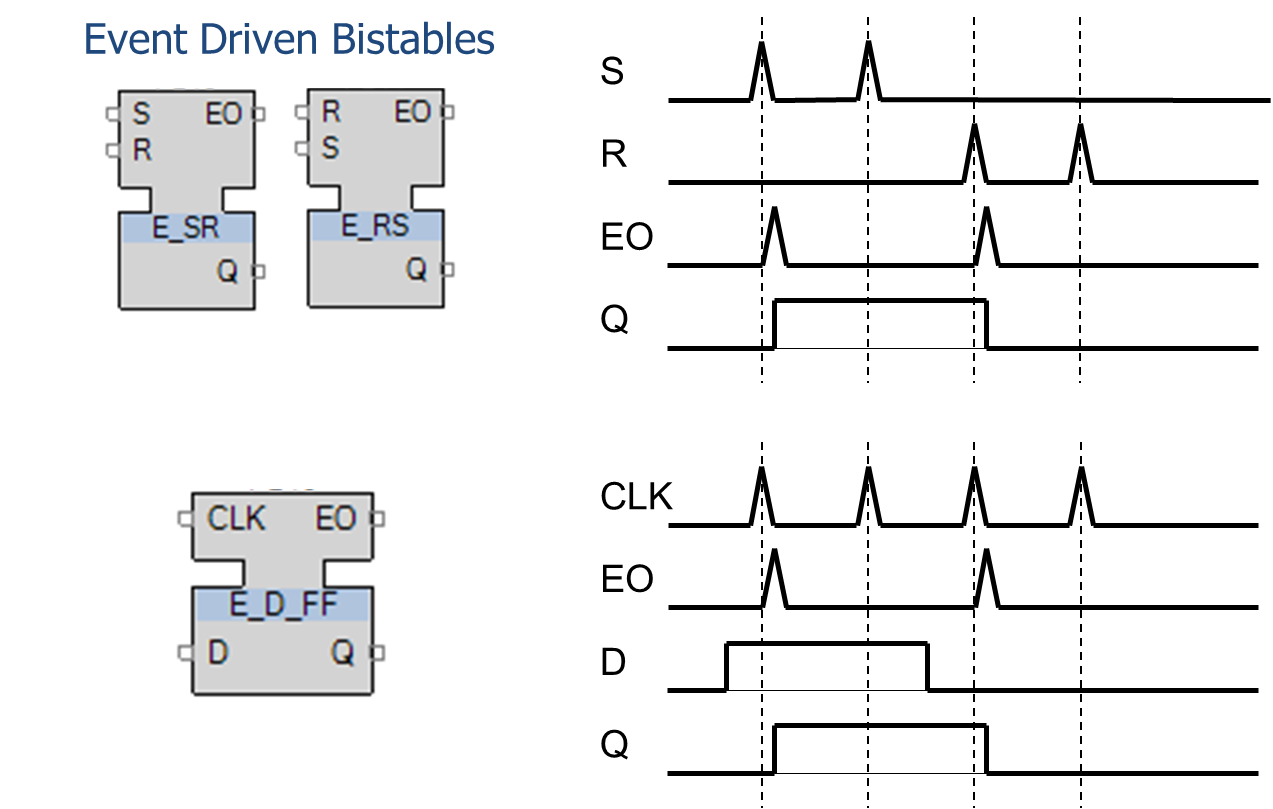 |
| 9 | D (Data latch) bistable | Q is set to 1 upon an event CLK if D is 1. It retains its value until D resets to 0 and CLK occurs. 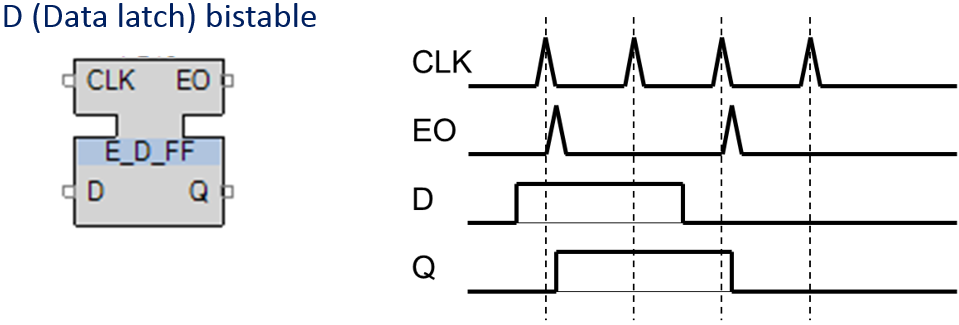 |